
Succeed In Forex Trading
Some of you almost always sees this from the professional or signal givers, telling you to sell at this point and apply risk management, and wonder what it means. Dont worry, i will be explaining this concepts and more in this article.
Firs thing first, let us know some Forex Jargons : (Buy, Sell, HH, HL, LL, LH, Lot size, Curency Pairs, Broker, Pips, Ticks, Support, Resistance, Take profit, Stop Loss)
1. Currency Pairs: this is just the currencies you choose to trade with e.g, Euro/Usd; this means you are trading your base currency, which is Euro for a Usd.
2. Buy/Sell: when you are buying a currency, say Euro/Usd, it means you are saying that Euro would appreciate in value against the Usd, while for Sell, you are that it would depreciate in value against the Usd
3. Higher Highs: simply means the market is moving up and making new highs i.e, the base currency is appreciating in value more and more than the previous valuation, while for a higher low it means the market is retracing its step but on a lower level than the previous high.The reverse is the case for Lower Low and Lower High
4. Lot size: this simple mean the unit at which you are wiiling to buy or sell the base currency. For example 0.01 is the lowest lot size for a currency pair while their is no maximum lot except when it is beyond the margin being aloted to you by your broker.
5. Broker: these are the companies that you register with to help carry out the execution of your tade in the market. They are like the middle men between the market and the trader.
6. Pips and tick: a pip is the percentage in points which indicate by how much a currency depreciats or appreciates e.g, 1.02346 can be for Euro/Usd, the last digit after the decimal (6) represent a single pip movement, (4) represt 10th, (3) represent 100th etc pip movement up until (0) which represnt 10,000 pips, and anything that goes beyond the decimal is called a tick, which in this case is 100,000 pips.
7. Take Profit/Stop Loss: this is an automated tading pattern used by traders to minimize loss and maximize profit. A take profit is a place setup by the trader to make the tade close and take his profit to his account balance and a stop loss is place setup by the trader to stop the level of loss incured when the market move against him.
Now that we know all this, let us dive into how to place a good trade and make sure you dont or minimize your loss and maximize your profit.
First the top-down analysis.
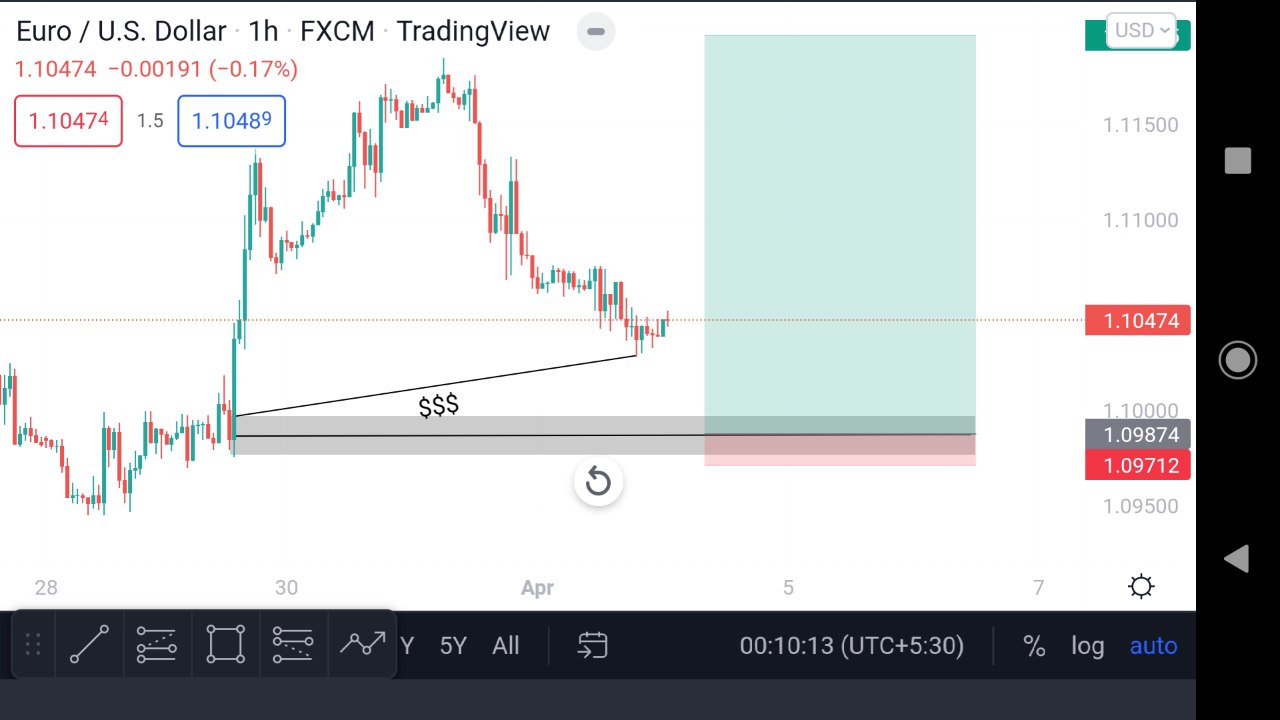
Observe the place marked as grey, this is the point where the market make a big leap upward with 5 large green candles. this is a point we traders call an order block, so this is going to be our resistance level, or the level which the market hits its lowest down movement and it is the place we would be taking our buy order, and if you look beneath it you could see a tiny red marking, that is going to bee our tight stop loss and the giant green box is where we take our profit.

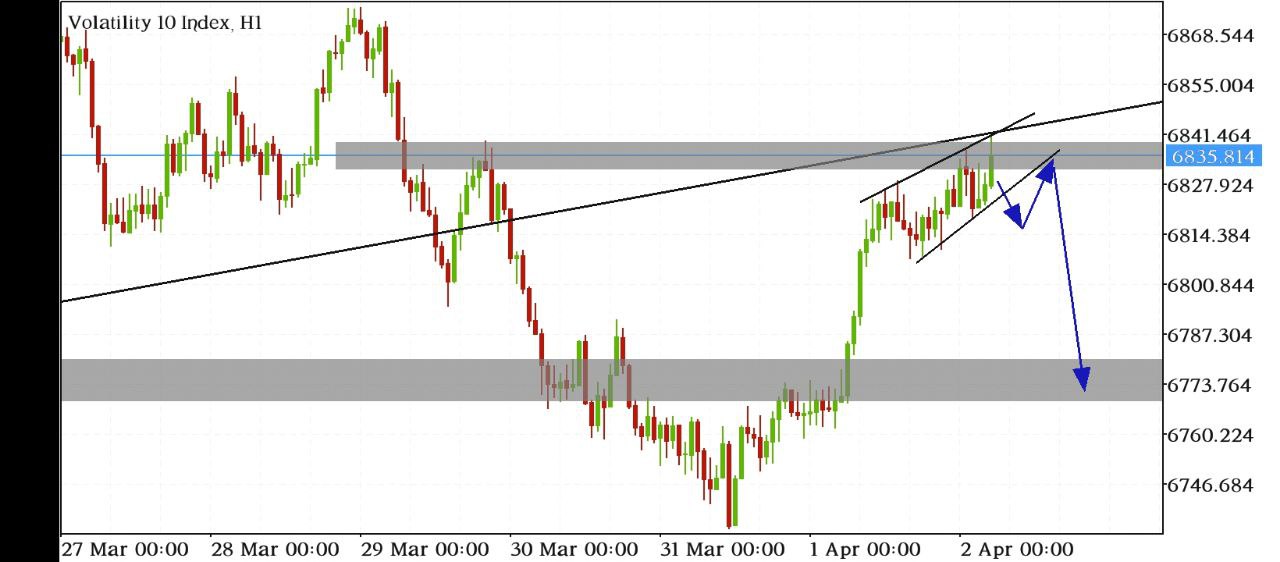
Secondly, The Trend Line analysis, this is an analysis used to move with the market flow e.g,
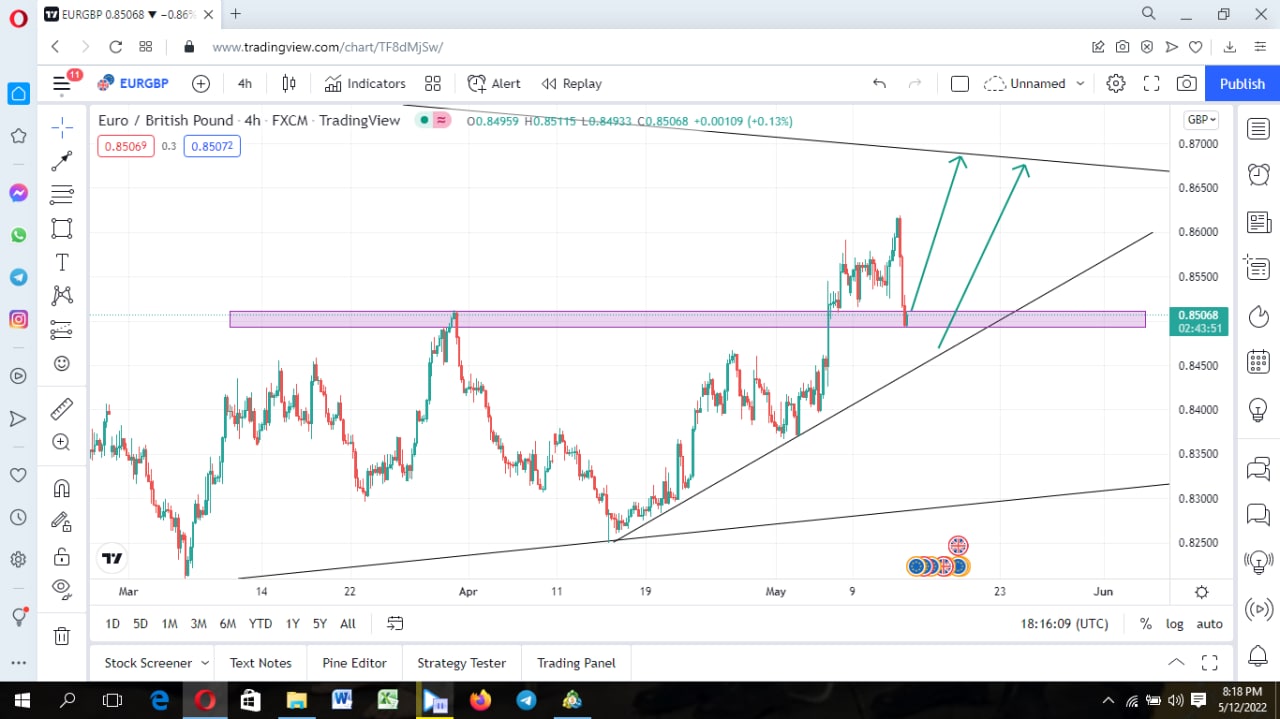
Look at those lines draw on the edges, these are trend lines indicating a continuous upward movement of the market as the market continues to make HH, and HL.
This are some of the analysis used by traders, but their are more like price action, using indicators like RSI, Moving average, Fibbonaci etc. I will take time in future articles to explain those methods in details.

You must be logged in to post a comment.